
01
AI ANALYSIS
Cedars Analyst
Upload a chart and receive structured analysis built around bias, key levels, scenarios, confirmations, invalidation and targets.
Explore Trading Tools →Cedars Chart centralizes technical analysis, economic intelligence, AI-assisted chart review, trader education and community access — built for scalpers and intraday traders who prefer structure over noise.
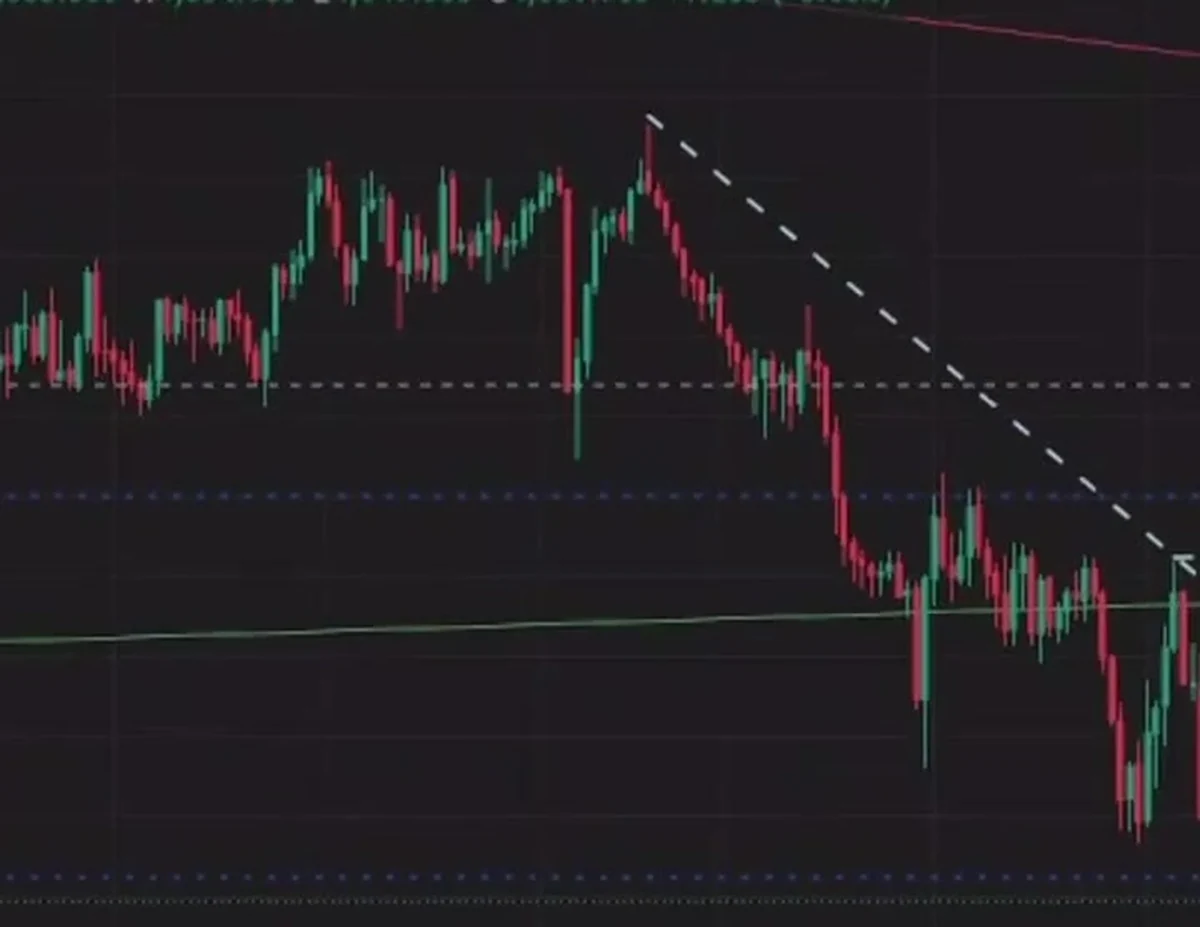
Each tool has one job: help you understand context, structure the setup, manage the event risk and sharpen execution.
Upload a chart and receive structured analysis built around bias, key levels, scenarios, confirmations, invalidation and targets.
Explore Trading Tools →Filter economic, geopolitical, metals and energy developments down to the updates active traders actually need.
View Market Watch →Plan around high-impact releases and major central-bank events instead of discovering them after volatility arrives.
View Calendar →Build a repeatable process for trendlines, top-down analysis, structure, risk management and trading psychology.
Explore Academy →Practical guides for gold, technical analysis, scalping and risk management — written to help traders understand the decision, not copy it.
Learn a structured XAUUSD scalping process using 1H location, 15M setup, 5M execution, support and resistance, confirmations and risk management.
Read guide →Learn how to identify practical support and resistance for scalping and intraday trading without overcrowding the chart with unnecessary levels.
Read guide →Learn practical trading-psychology and risk-management habits that reduce impulsive decisions, revenge trading and oversized risk.
Read guide →Understand how AI chart analysis can help traders organize technical evidence, scenarios and risk without replacing judgment or guaranteeing outcomes.
Read guide →Track the market, review economic risk, analyze charts with Cedars Analyst, access educational resources, and stay connected to the Cedars community — all in one place.
Open Market DeskCedars Chart is built to improve process, not replace judgment.
Start with location, session conditions, major levels and event risk.
Define the trendline, setup type, confirmation and invalidation before entry.
Use the lower timeframe for timing only after the setup is valid.
Use the official Cedars Chart referral path. Registration, verification, deposits, withdrawals and execution are handled directly by the broker.
Discuss charts, market structure, economic events, risk management and real market conditions with traders who care about the reasoning behind the decision.
Explore Community / VIP